[Jun 27, 2022] Vanilla Model Training
Predicting Hispanic ethnicity from Texas-100X (I)
Threat Setting:
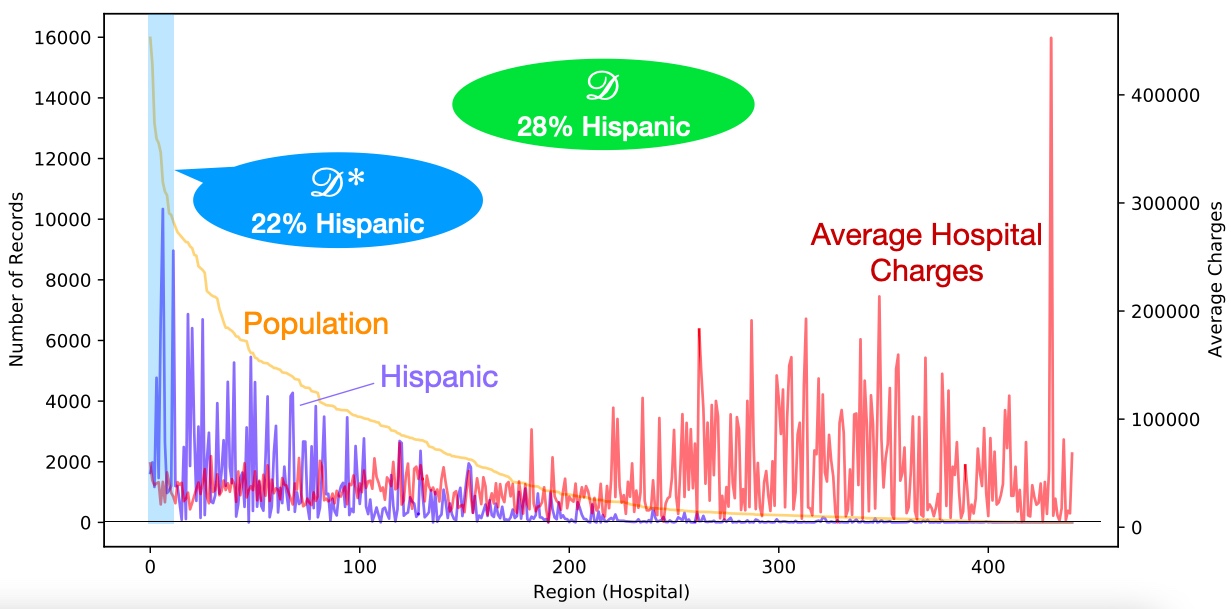
Training distirbution is general data set distribution except the most populous hospitals.Adversarial Knowledge:
- High: Adversary knows all but one record from training set.
- Medium: Adversary knows the training distribution (i.e. can sample records with no intersection with training set).
- Low: Adversary knows a skewed distribution (that has records from hospitals with highest number of patients).
Model uses race as a training feature
As reported in the paper draft, the model trained on Texas-100X data set uses the race attribute as a feature which could have a positive correlation with the ethnicity attribute. Regardless of this, it is still useful to compare the attribute inference attacks with the imputation (IP) attack in this setting.
Hypothesis: Passing WB$\cdot$IP as a feature to WB$\diamondsuit$IP’s decision tree should improve the attack.
Remark: The result is a mixed bag. WB$\square$IP attack does better than WB$\diamondsuit$IP attack in many (but not all) cases. Still for most cases, WB$\square$IP doesn’t do better than WB$\cdot$IP.
Hypothesis: There should be no gap between attribute inference and imputation with knowledge of train set.
Remark: There is a considerable gap, even though this gap is reduced when imputation is trained with class label.
WB$\cdot$IP multiplies the outputs of WB and IP
WB$\diamondsuit$IP uses a decision tree model to combine WB and IP
WB$\square$IP uses a decision tree model to combine WB, IP and WB$\cdot$IP
IP$^\dagger$ is the imputation with access to class labelCandidate Sets:
- Train: Subset of 10,000 candidate records drawn from the training set.
- Test: Subset of 10,000 candidate records randomly sampled from the training distribution.
- OOD: Subset of 10,000 candidate records randomly sampled from a distribution different from the training distribution.
| High (Train) | High (Test) | Med (Train) | Med (Test) | Low (Train) | Low (Test) | |
|---|---|---|---|---|---|---|
| Random | 29 $\pm$ 0 | 28 $\pm$ 0 | 29 $\pm$ 0 | 28 $\pm$ 0 | 29 $\pm$ 0 | 28 $\pm$ 0 |
| IP | 81 $\pm$ 2 | 79 $\pm$ 2 | 79 $\pm$ 4 | 75 $\pm$ 2 | 76 $\pm$ 3 | 80 $\pm$ 4 |
| IP$^\dagger$ | 83 $\pm$ 2 | 82 $\pm$ 2 | 82 $\pm$ 2 | 80 $\pm$ 5 | 80 $\pm$ 4 | 79 $\pm$ 4 |
| WB | 88 $\pm$ 3 | 86 $\pm$ 3 | 88 $\pm$ 3 | 87 $\pm$ 1 | 89 $\pm$ 3 | 90 $\pm$ 3 |
| WB$\cdot$IP | 86 $\pm$ 4 | 86 $\pm$ 3 | 88 $\pm$ 4 | 87 $\pm$ 3 | 86 $\pm$ 2 | 89 $\pm$ 3 |
| WB$\diamondsuit$IP | 86 $\pm$ 2 | 85 $\pm$ 4 | 86 $\pm$ 2 | 82 $\pm$ 5 | 74 $\pm$ 6 | 75 $\pm$ 7 |
| WB$\square$IP | 87 $\pm$ 3 | 84 $\pm$ 4 | 87 $\pm$ 3 | 85 $\pm$ 4 | 79 $\pm$ 8 | 78 $\pm$ 8 |
| WB$\cdot$IP$^\dagger$ | 86 $\pm$ 2 | 85 $\pm$ 2 | 89 $\pm$ 3 | 87 $\pm$ 3 | 88 $\pm$ 3 | 89 $\pm$ 3 |
| WB$\diamondsuit$IP$^\dagger$ | 86 $\pm$ 6 | 80 $\pm$ 4 | 86 $\pm$ 3 | 84 $\pm$ 5 | 79 $\pm$ 9 | 74 $\pm$ 8 |
| WB$\square$IP$^\dagger$ | 88 $\pm$ 3 | 85 $\pm$ 3 | 88 $\pm$ 2 | 84 $\pm$ 5 | 83 $\pm$ 9 | 77 $\pm$ 9 |
Model doesn’t have access to race
Here we study the impact of removing race from the model training. Since race and ethnicity have implicit correlation, it would be more realistic to assume the adversary trying to infer ethnicity would not know the race of the query record.
| High (Train) | High (Test) | Med (Train) | Med (Test) | Low (Train) | Low (Test) | |
|---|---|---|---|---|---|---|
| Random | 29 $\pm$ 0 | 28 $\pm$ 0 | 29 $\pm$ 0 | 28 $\pm$ 0 | 29 $\pm$ 0 | 28 $\pm$ 0 |
| IP | 44 $\pm$ 5 | 40 $\pm$ 4 | 47 $\pm$ 8 | 47 $\pm$ 3 | 36 $\pm$ 4 | 39 $\pm$ 4 |
| IP$^\dagger$ | 45 $\pm$ 2 | 41 $\pm$ 3 | 44 $\pm$ 4 | 43 $\pm$ 4 | 38 $\pm$ 5 | 43 $\pm$ 5 |
| WB | 55 $\pm$ 3 | 52 $\pm$ 4 | 54 $\pm$ 3 | 53 $\pm$ 4 | 55 $\pm$ 4 | 54 $\pm$ 5 |
| WB$\cdot$IP | 60 $\pm$ 3 | 57 $\pm$ 5 | 63 $\pm$ 6 | 59 $\pm$ 2 | 52 $\pm$ 6 | 51 $\pm$ 6 |
| WB$\diamondsuit$IP | 61 $\pm$ 3 | 61 $\pm$ 6 | 61 $\pm$ 3 | 57 $\pm$ 5 | 47 $\pm$ 6 | 49 $\pm$ 4 |
| WB$\square$IP | 61 $\pm$ 6 | 57 $\pm$ 5 | 61 $\pm$ 4 | 56 $\pm$ 7 | 48 $\pm$ 7 | 49 $\pm$ 5 |
| WB$\cdot$IP$^\dagger$ | 61 $\pm$ 3 | 57 $\pm$ 4 | 61 $\pm$ 3 | 58 $\pm$ 4 | 51 $\pm$ 5 | 50 $\pm$ 3 |
| WB$\diamondsuit$IP$^\dagger$ | 58 $\pm$ 4 | 55 $\pm$ 6 | 56 $\pm$ 2 | 55 $\pm$ 7 | 48 $\pm$ 8 | 46 $\pm$ 8 |
| WB$\square$IP$^\dagger$ | 57 $\pm$ 3 | 55 $\pm$ 2 | 57 $\pm$ 3 | 58 $\pm$ 4 | 48 $\pm$ 6 | 45 $\pm$ 7 |
Remark: From the results in Table 2, we can see the impact of removing race attribute on ethnicity inference. The imputation PPV drops from ~80% to ~40%.
Results on out-of-distribution candidate set
| High (with Race) |
Med (with Race) |
Low (with Race) |
High (w/o Race) |
Med (w/o Race) |
Low (w/o Race) |
|
|---|---|---|---|---|---|---|
| Random | 24 $\pm$ 0 | 24 $\pm$ 0 | 24 $\pm$ 0 | 24 $\pm$ 0 | 24 $\pm$ 0 | 24 $\pm$ 0 |
| IP | 70 $\pm$ 3 | 71 $\pm$ 5 | 81 $\pm$ 2 | 37 $\pm$ 10 | 32 $\pm$ 3 | 52 $\pm$ 4 |
| IP$^\dagger$ | 73 $\pm$ 3 | 73 $\pm$ 4 | 78 $\pm$ 4 | 37 $\pm$ 5 | 30 $\pm$ 2 | 61 $\pm$ 4 |
| WB | 84 $\pm$ 6 | 86 $\pm$ 5 | 91 $\pm$ 4 | 60 $\pm$ 7 | 62 $\pm$ 7 | 65 $\pm$ 3 |
| WB$\cdot$IP | 78 $\pm$ 5 | 85 $\pm$ 4 | 91 $\pm$ 3 | 55 $\pm$ 9 | 61 $\pm$ 7 | 85 $\pm$ 2 |
| WB$\diamondsuit$IP | 86 $\pm$ 3 | 86 $\pm$ 3 | 91 $\pm$ 2 | 63 $\pm$ 4 | 54 $\pm$ 3 | 82 $\pm$ 4 |
| WB$\square$IP | 86 $\pm$ 3 | 87 $\pm$ 4 | 93 $\pm$ 1 | 56 $\pm$ 5 | 55 $\pm$ 3 | 85 $\pm$ 2 |
| WB$\cdot$IP$^\dagger$ | 77 $\pm$ 4 | 84 $\pm$ 4 | 88 $\pm$ 3 | 66 $\pm$ 5 | 61 $\pm$ 4 | 82 $\pm$ 5 |
| WB$\diamondsuit$IP$^\dagger$ | 83 $\pm$ 6 | 84 $\pm$ 4 | 90 $\pm$ 3 | 56 $\pm$ 5 | 60 $\pm$ 9 | 83 $\pm$ 2 |
| WB$\square$IP$^\dagger$ | 87 $\pm$ 1 | 86 $\pm$ 3 | 90 $\pm$ 2 | 54 $\pm$ 5 | 60 $\pm$ 7 | 82 $\pm$ 1 |
Predicting Hispanic ethnicity from Texas-100X (II)
Here we consider the scenario where the training data comes from skewed distribution, while an adversary (in low adversarial knowledge setting) might have access to the general pupulation distribution.
Threat Setting:
Training distirbution is a skewed distribution limited to records from most populous hospitals.Adversarial Knowledge:
- High: Adversary knows all but one record from training set.
- Medium: Adversary knows the training distribution (i.e. can sample records with no intersection with training set).
- Low: Adversary knows the general data set distribution except the most populous hospitals.
Model uses race as a training feature
| High (Train) | High (Test) | Med (Train) | Med (Test) | Low (Train) | Low (Test) | |
|---|---|---|---|---|---|---|
| Random | 24 $\pm$ 0 | 24 $\pm$ 0 | 24 $\pm$ 0 | 24 $\pm$ 0 | 24 $\pm$ 0 | 24 $\pm$ 0 |
| IP | 86 $\pm$ 3 | 83 $\pm$ 3 | 88 $\pm$ 3 | 87 $\pm$ 3 | 72 $\pm$ 4 | 65 $\pm$ 4 |
| IP$^\dagger$ | 84 $\pm$ 2 | 85 $\pm$ 1 | 87 $\pm$ 2 | 82 $\pm$ 2 | 73 $\pm$ 4 | 67 $\pm$ 6 |
| WB | 92 $\pm$ 2 | 90 $\pm$ 4 | 93 $\pm$ 2 | 90 $\pm$ 4 | 84 $\pm$ 6 | 81 $\pm$ 6 |
| WB$\cdot$IP | 95 $\pm$ 3 | 89 $\pm$ 3 | 96 $\pm$ 1 | 93 $\pm$ 3 | 79 $\pm$ 3 | 78 $\pm$ 4 |
| WB$\diamondsuit$IP | 90 $\pm$ 3 | 90 $\pm$ 3 | 92 $\pm$ 3 | 92 $\pm$ 2 | 81 $\pm$ 5 | 79 $\pm$ 7 |
| WB$\square$IP | 90 $\pm$ 1 | 89 $\pm$ 3 | 92 $\pm$ 2 | 91 $\pm$ 2 | 80 $\pm$ 4 | 77 $\pm$ 7 |
| WB$\cdot$IP$^\dagger$ | 95 $\pm$ 3 | 89 $\pm$ 4 | 95 $\pm$ 1 | 90 $\pm$ 4 | 81 $\pm$ 5 | 79 $\pm$ 4 |
| WB$\diamondsuit$IP$^\dagger$ | 90 $\pm$ 3 | 90 $\pm$ 3 | 92 $\pm$ 4 | 91 $\pm$ 1 | 82 $\pm$ 5 | 80 $\pm$ 5 |
| WB$\square$IP$^\dagger$ | 92 $\pm$ 4 | 89 $\pm$ 3 | 91 $\pm$ 3 | 90 $\pm$ 1 | 80 $\pm$ 6 | 78 $\pm$ 6 |
Remark: As shown in Table 3, IP$^\dagger$ performs slightly worse than IP. Hence the class label seems to have a negative correlation with the Hispanic ethnicity in this setting where training records come from a skewed distribution.
Model doesn’t have access to race
| High (Train) | High (Test) | Med (Train) | Med (Test) | Low (Train) | Low (Test) | |
|---|---|---|---|---|---|---|
| Random | 24 $\pm$ 0 | 24 $\pm$ 0 | 24 $\pm$ 0 | 24 $\pm$ 0 | 24 $\pm$ 0 | 24 $\pm$ 0 |
| IP | 65 $\pm$ 4 | 61 $\pm$ 4 | 70 $\pm$ 6 | 72 $\pm$ 5 | 32 $\pm$ 4 | 32 $\pm$ 6 |
| IP$^\dagger$ | 64 $\pm$ 5 | 62 $\pm$ 6 | 70 $\pm$ 3 | 68 $\pm$ 4 | 37 $\pm$ 2 | 36 $\pm$ 4 |
| WB | 57 $\pm$ 6 | 57 $\pm$ 8 | 56 $\pm$ 4 | 56 $\pm$ 7 | 57 $\pm$ 4 | 56 $\pm$ 6 |
| WB$\cdot$IP | 89 $\pm$ 5 | 86 $\pm$ 5 | 90 $\pm$ 2 | 88 $\pm$ 4 | 58 $\pm$ 3 | 58 $\pm$ 5 |
| WB$\diamondsuit$IP | 84 $\pm$ 5 | 85 $\pm$ 4 | 82 $\pm$ 2 | 85 $\pm$ 3 | 58 $\pm$ 6 | 58 $\pm$ 5 |
| WB$\square$IP | 84 $\pm$ 7 | 84 $\pm$ 5 | 85 $\pm$ 2 | 85 $\pm$ 4 | 60 $\pm$ 6 | 59 $\pm$ 5 |
| WB$\cdot$IP$^\dagger$ | 83 $\pm$ 3 | 85 $\pm$ 4 | 88 $\pm$ 3 | 87 $\pm$ 4 | 67 $\pm$ 4 | 65 $\pm$ 5 |
| WB$\diamondsuit$IP$^\dagger$ | 81 $\pm$ 5 | 84 $\pm$ 4 | 82 $\pm$ 4 | 85 $\pm$ 2 | 60 $\pm$ 4 | 60 $\pm$ 4 |
| WB$\square$IP$^\dagger$ | 84 $\pm$ 4 | 86 $\pm$ 3 | 84 $\pm$ 4 | 86 $\pm$ 2 | 59 $\pm$ 6 | 58 $\pm$ 3 |
Remark: Similar to previous case, race’s correlation to ethnicity has a huge impact on the inference task.
Results on out-of-distribution candidate set
| High (with Race) |
Med (with Race) |
Low (with Race) |
High (w/o Race) |
Med (w/o Race) |
Low (w/o Race) |
|
|---|---|---|---|---|---|---|
| Random | 28 $\pm$ 0 | 28 $\pm$ 0 | 28 $\pm$ 0 | 28 $\pm$ 0 | 28 $\pm$ 0 | 28 $\pm$ 0 |
| IP | 76 $\pm$ 5 | 76 $\pm$ 4 | 80 $\pm$ 2 | 37 $\pm$ 2 | 43 $\pm$ 4 | 41 $\pm$ 2 |
| IP$^\dagger$ | 81 $\pm$ 2 | 75 $\pm$ 2 | 80 $\pm$ 3 | 42 $\pm$ 3 | 40 $\pm$ 3 | 38 $\pm$ 7 |
| WB | 87 $\pm$ 2 | 87 $\pm$ 2 | 81 $\pm$ 3 | 51 $\pm$ 5 | 52 $\pm$ 4 | 50 $\pm$ 3 |
| WB$\cdot$IP | 86 $\pm$ 4 | 89 $\pm$ 2 | 85 $\pm$ 2 | 53 $\pm$ 2 | 53 $\pm$ 2 | 63 $\pm$ 3 |
| WB$\diamondsuit$IP | 74 $\pm$ 5 | 74 $\pm$ 2 | 85 $\pm$ 2 | 45 $\pm$ 2 | 47 $\pm$ 3 | 59 $\pm$ 4 |
| WB$\square$IP | 75 $\pm$ 1 | 81 $\pm$ 6 | 83 $\pm$ 3 | 46 $\pm$ 2 | 46 $\pm$ 3 | 58 $\pm$ 4 |
| WB$\cdot$IP$^\dagger$ | 88 $\pm$ 2 | 90 $\pm$ 2 | 84 $\pm$ 1 | 56 $\pm$ 4 | 53 $\pm$ 4 | 61 $\pm$ 4 |
| WB$\diamondsuit$IP$^\dagger$ | 78 $\pm$ 7 | 74 $\pm$ 5 | 85 $\pm$ 2 | 44 $\pm$ 2 | 46 $\pm$ 3 | 58 $\pm$ 4 |
| WB$\square$IP$^\dagger$ | 81 $\pm$ 5 | 78 $\pm$ 7 | 85 $\pm$ 3 | 45 $\pm$ 3 | 45 $\pm$ 2 | 57 $\pm$ 5 |
Comments
- In all the above settings, the white-box attacks perform similar on both training and test candidates, unlike the membership inference case where the attacks perform dissimilar across training and test candidate sets.
- White-box attack outperforms even the imputation attack that has access to the class label. Thus, the model is leaking something beyond what an imputation can learn from the same data that the model is trained on. Is this because the imputation model is not learning effectively?
[Jul 14, 2022] Vanilla Model Training [Contd.]
Here we study the inference of Asian race from Texas-100X data set to see if the trend is same as what we observed for ethnicity attribute above. For this experiment, we remove the ethnicity attribute from the model training, since it is correlated to the target race attribute as we saw above.
Predicting Asian race from Texas-100X (I)
The model is trained on general distribution and the adversary might have access to either the training set, or training distribution or a different distribution based on the adversarial knowledge. In the general distribution, 22% of records have Asian race.
| High (Train) | High (Test) | Med (Train) | Med (Test) | Low (Train) | Low (Test) | |
|---|---|---|---|---|---|---|
| Random | 22 $\pm$ 0 | 22 $\pm$ 0 | 22 $\pm$ 0 | 22 $\pm$ 0 | 22 $\pm$ 0 | 22 $\pm$ 0 |
| IP | 34 $\pm$ 6 | 30 $\pm$ 5 | 38 $\pm$ 5 | 32 $\pm$ 6 | 24 $\pm$ 4 | 19 $\pm$ 4 |
| IP$^\dagger$ | 32 $\pm$ 4 | 31 $\pm$ 1 | 33 $\pm$ 5 | 32 $\pm$ 3 | 24 $\pm$ 3 | 21 $\pm$ 3 |
| WB | 36 $\pm$ 2 | 33 $\pm$ 5 | 36 $\pm$ 3 | 33 $\pm$ 4 | 37 $\pm$ 4 | 35 $\pm$ 5 |
| WB$\cdot$IP | 46 $\pm$ 1 | 43 $\pm$ 3 | 46 $\pm$ 2 | 51 $\pm$ 4 | 29 $\pm$ 2 | 24 $\pm$ 4 |
| WB$\diamondsuit$IP | 40 $\pm$ 4 | 42 $\pm$ 6 | 47 $\pm$ 3 | 49 $\pm$ 5 | 29 $\pm$ 3 | 34 $\pm$ 3 |
| WB$\square$IP | 43 $\pm$ 7 | 44 $\pm$ 5 | 44 $\pm$ 5 | 48 $\pm$ 2 | 32 $\pm$ 6 | 32 $\pm$ 5 |
| WB$\cdot$IP$^\dagger$ | 47 $\pm$ 2 | 46 $\pm$ 3 | 46 $\pm$ 4 | 47 $\pm$ 6 | 31 $\pm$ 3 | 25 $\pm$ 4 |
| WB$\diamondsuit$IP$^\dagger$ | 46 $\pm$ 6 | 46 $\pm$ 3 | 46 $\pm$ 5 | 51 $\pm$ 4 | 34 $\pm$ 2 | 36 $\pm$ 2 |
| WB$\square$IP$^\dagger$ | 47 $\pm$ 3 | 46 $\pm$ 1 | 45 $\pm$ 9 | 49 $\pm$ 6 | 33 $\pm$ 5 | 36 $\pm$ 4 |
Remark: We observe the same trend— white-box attack does better than imputation and combining drastically improves the PPV of the combined attack on the general distribution candidate sets. Thus model is learning something useful about the distribution beyond the imputation. In the low setting, where the adversary only has access to skewed distribution, white-box attack still learns something useful, but combining with imputation does not further improve the PPV, suggesting that the attack signal is not different from imputation.
Predicting Asian race from Texas-100X (II)
Here the model is trained on the skewed distribution that has 15% of records with Asian race.
| High (Train) | High (Test) | Med (Train) | Med (Test) | Low (Train) | Low (Test) | |
|---|---|---|---|---|---|---|
| Random | 15 $\pm$ 0 | 15 $\pm$ 0 | 15 $\pm$ 0 | 15 $\pm$ 0 | 15 $\pm$ 0 | 15 $\pm$ 0 |
| IP | 29 $\pm$ 4 | 26 $\pm$ 5 | 25 $\pm$ 4 | 25 $\pm$ 3 | 18 $\pm$ 5 | 16 $\pm$ 4 |
| IP$^\dagger$ | 29 $\pm$ 3 | 31 $\pm$ 3 | 30 $\pm$ 4 | 28 $\pm$ 5 | 19 $\pm$ 4 | 14 $\pm$ 1 |
| WB | 40 $\pm$ 7 | 34 $\pm$ 7 | 40 $\pm$ 6 | 35 $\pm$ 6 | 34 $\pm$ 3 | 36 $\pm$ 3 |
| WB$\cdot$IP | 46 $\pm$ 5 | 46 $\pm$ 4 | 47 $\pm$ 5 | 48 $\pm$ 4 | 18 $\pm$ 3 | 18 $\pm$ 3 |
| WB$\diamondsuit$IP | 50 $\pm$ 3 | 55 $\pm$ 10 | 54 $\pm$ 4 | 55 $\pm$ 10 | 17 $\pm$ 6 | 16 $\pm$ 4 |
| WB$\square$IP | 53 $\pm$ 4 | 54 $\pm$ 6 | 54 $\pm$ 2 | 54 $\pm$ 3 | 20 $\pm$ 2 | 17 $\pm$ 1 |
| WB$\cdot$IP$^\dagger$ | 44 $\pm$ 2 | 49 $\pm$ 3 | 46 $\pm$ 6 | 42 $\pm$ 6 | 21 $\pm$ 3 | 20 $\pm$ 4 |
| WB$\diamondsuit$IP$^\dagger$ | 53 $\pm$ 5 | 55 $\pm$ 7 | 57 $\pm$ 4 | 58 $\pm$ 8 | 16 $\pm$ 7 | 19 $\pm$ 8 |
| WB$\square$IP$^\dagger$ | 53 $\pm$ 6 | 58 $\pm$ 5 | 54 $\pm$ 4 | 58 $\pm$ 8 | 19 $\pm$ 6 | 18 $\pm$ 3 |
Remark: Here also the observation is the same. White-box attack does better than imputation when the model is trained on the skewed distribution and the candidate sets are also from the skewed distribution.
Results on out-of-distribution candidate set
Here we evaluate the attacks on out-of-distribution candidate set. For the model trained on general distribution, the OOD set is from the skewed distribution, and vice-versa.
| High (skewed $\mathcal{D}$) |
Med (skewed $\mathcal{D}$) |
Low (skewed $\mathcal{D}$) |
High (general $\mathcal{D}$) |
Med (general $\mathcal{D}$) |
Low (general $\mathcal{D}$) |
|
|---|---|---|---|---|---|---|
| Random | 15 $\pm$ 0 | 15 $\pm$ 0 | 15 $\pm$ 0 | 21 $\pm$ 0 | 21 $\pm$ 0 | 21 $\pm$ 0 |
| IP | 17 $\pm$ 2 | 16 $\pm$ 5 | 31 $\pm$ 4 | 26 $\pm$ 4 | 22 $\pm$ 2 | 29 $\pm$ 3 |
| IP$^\dagger$ | 17 $\pm$ 2 | 16 $\pm$ 4 | 32 $\pm$ 4 | 23 $\pm$ 5 | 25 $\pm$ 4 | 30 $\pm$ 2 |
| WB | 36 $\pm$ 8 | 36 $\pm$ 8 | 40 $\pm$ 6 | 35 $\pm$ 5 | 35 $\pm$ 5 | 35 $\pm$ 3 |
| WB$\cdot$IP | 22 $\pm$ 4 | 22 $\pm$ 5 | 46 $\pm$ 3 | 32 $\pm$ 3 | 29 $\pm$ 3 | 43 $\pm$ 3 |
| WB$\diamondsuit$IP | 19 $\pm$ 3 | 19 $\pm$ 3 | 57 $\pm$ 6 | 33 $\pm$ 4 | 31 $\pm$ 2 | 45 $\pm$ 5 |
| WB$\square$IP | 22 $\pm$ 0 | 20 $\pm$ 5 | 55 $\pm$ 4 | 33 $\pm$ 5 | 33 $\pm$ 2 | 42 $\pm$ 8 |
| WB$\cdot$IP$^\dagger$ | 24 $\pm$ 3 | 21 $\pm$ 2 | 50 $\pm$ 3 | 32 $\pm$ 5 | 28 $\pm$ 2 | 44 $\pm$ 7 |
| WB$\diamondsuit$IP$^\dagger$ | 19 $\pm$ 4 | 19 $\pm$ 3 | 57 $\pm$ 4 | 32 $\pm$ 3 | 31 $\pm$ 5 | 43 $\pm$ 5 |
| WB$\square$IP$^\dagger$ | 20 $\pm$ 6 | 20 $\pm$ 3 | 57 $\pm$ 3 | 32 $\pm$ 4 | 31 $\pm$ 4 | 39 $\pm$ 4 |